

XRP price has formed a bullish reversal pattern as whales continued buying the token.
Summary
- XRP price has fallen 15% so far in December.
- Positive performance of XRP ETFs and renewed whale buying could improve market sentiment for the token.
- A descending wedge pattern has formed on the 24-hour chart.
According to data from crypto.news, XRP (XRP) price has dropped by nearly 15% so far in December. Trading at $1.88 at press time, the losses extend to 47% from its yearly high on zooming out charts.
The fifth-largest crypto asset’s market cap dropped from its yearly high of $210.4 billion to $113.8 billion, while daily trading also slumped from $13.2 billion in July to just $1.8 billion at last check on Friday, Dec. 26, Asian time.
Despite its downtrend, several catalysts backing the project could potentially support a turnaround over the coming weeks.
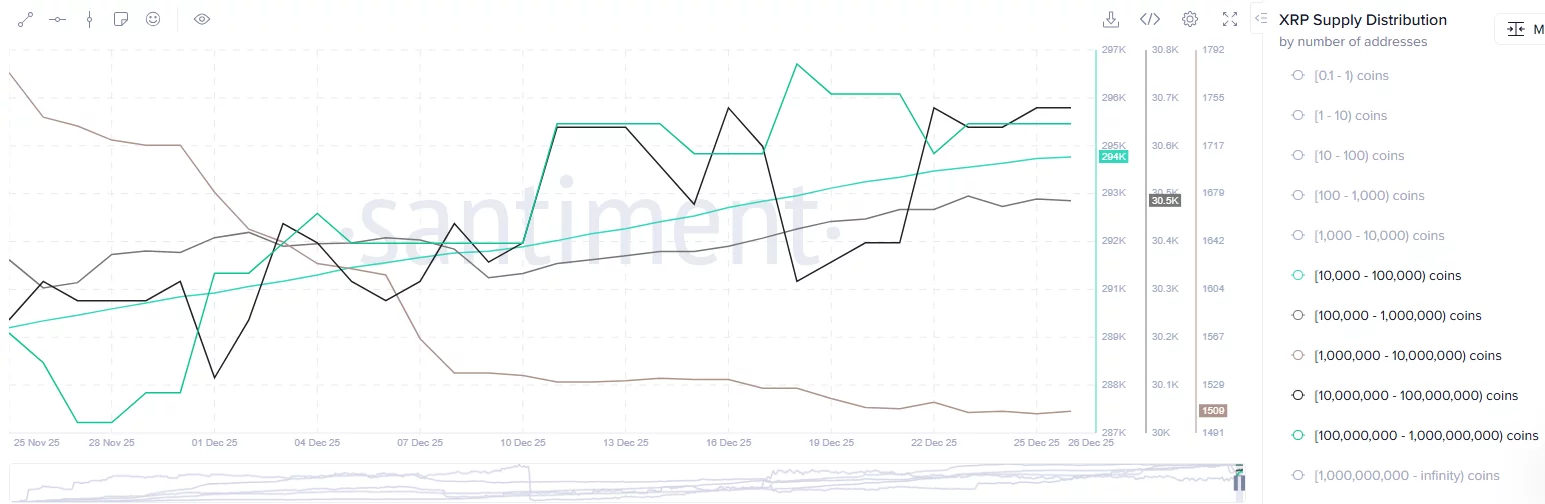
Notably, whales have shown renewed interest in the token and have started accumulating it over the past week. Data from Santiment shows that the number of whales holding between 10,000 and 1 billion tokens has risen since Dec. 22. Such whale buying, if sustained, can improve investor sentiment and hence drive the token’s price higher in the short term.
Another catalyst is that American investors have been continuously accumulating the token. Data from SoSoValue shows that they have bought XRP ETFs worth $64 million this week, bringing the cumulative inflows to $1.14 billion. At press time, the funds held over $1.25 billion in assets, and together they have not seen a single net outflow day since their approval in November.
On the daily chart, XRP price has formed a descending wedge pattern as it entered a downtrend, marked by a series of lower lows and lower highs. Typically, such patterns have formed when downtrends come to an end. If the current demand persists, it could support an upside rally.
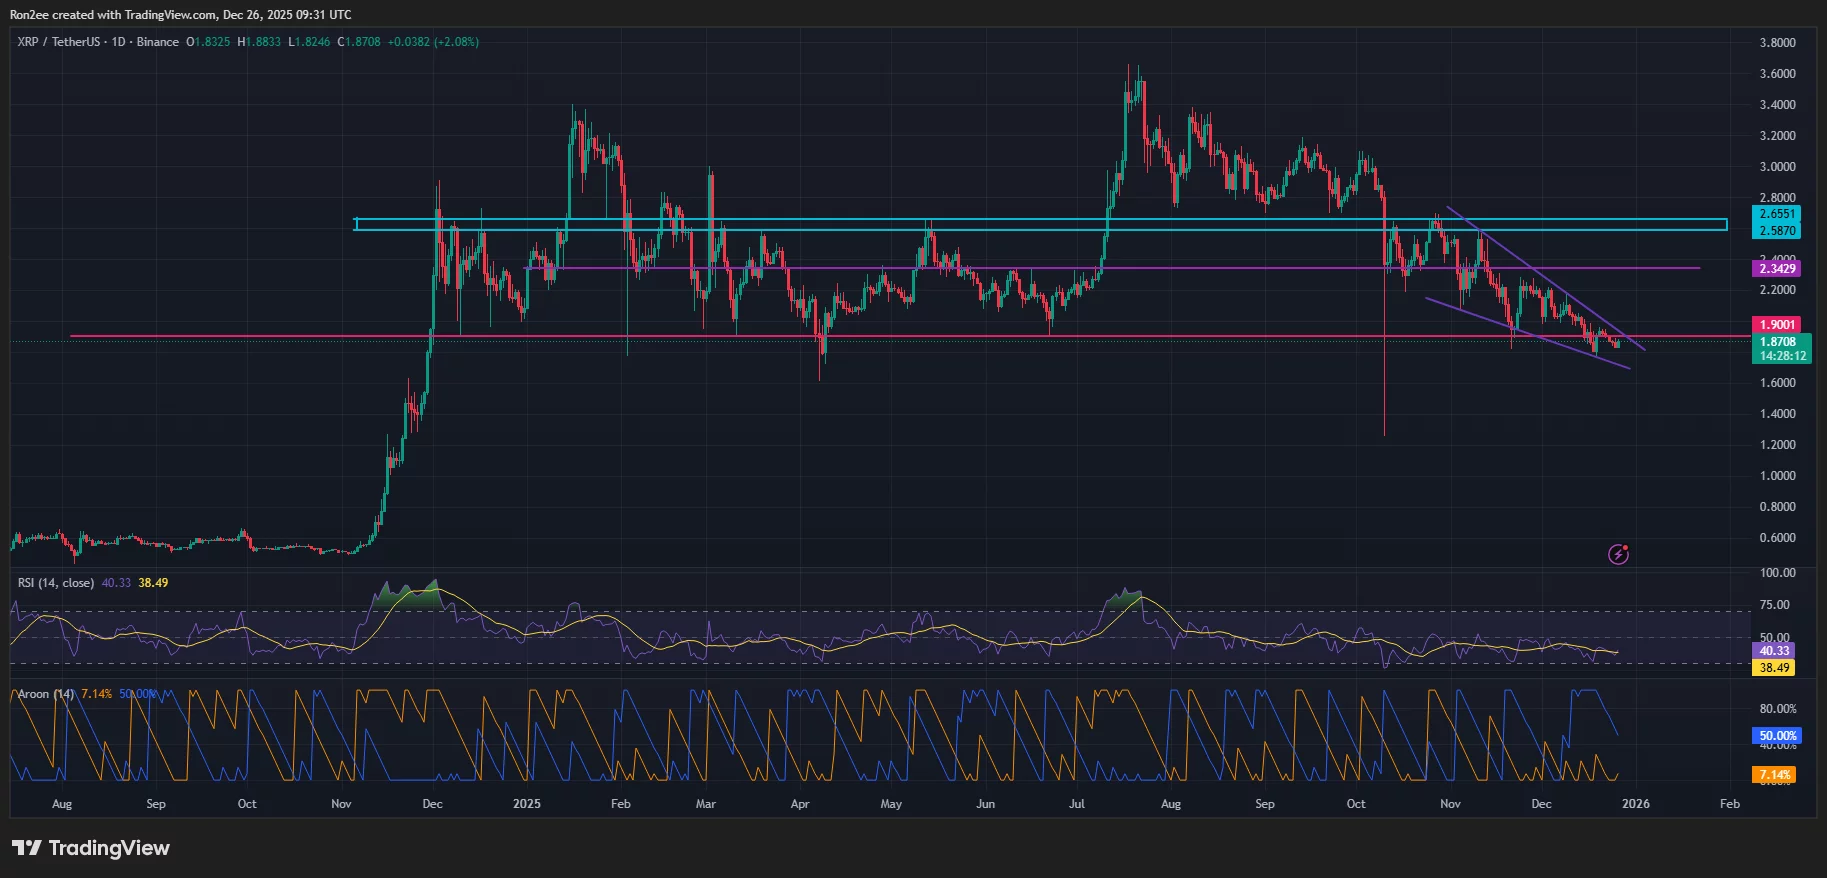
At press time, XRP price was also testing a breakout from the support and resistance levels at $1.90.
A breakout from the level would also confirm the wedge pattern and could trigger a rally to the $2.58–$2.65 zone, which has been acting as a key resistance zone throughout this year. Based on current prices, the zone lies roughly 27% above.
Momentum indicators also show the shift underway, with the Aroon Down showing a drop in selling pressure, while the RSI stood near oversold levels and suggested a potential rebound could be underway.
Momentum indicators are also beginning to shift in favor of the bulls. Selling pressure is clearly drying up now that the Aroon Down has dropped to 50%, and with the RSI sitting right near oversold territory, it looks like a trend reversal could already be in motion.
Disclosure: This article does not represent investment advice. The content and materials featured on this page are for educational purposes only.