

Bonk has pulled back into a major support level aligned with the 0.618 Fibonacci retracement, the daily high time frame (HTF) support, and a key volume node. Price is now sitting at a make-or-break level that could dictate the next directional move.
Summary
- Bonk is at a high-confluence support with Fibonacci, daily structure, and volume backing.
- Holding the zone forms a higher low and supports bullish continuation.
- Breakdown could trigger a move to the value area low and invalidate the current trend.
After failing to close above daily swing high resistance, Bonk (BONK) initiated a deeper correction that has now led price into a high-confluence support region. This zone includes the 0.618 Fibonacci retracement level, the HTF daily support, and the point of control from the current volume range. The coming days will determine whether this level holds as a base for continuation or breaks to invite further downside.
Key technical points
- Support Confluence: 0.618 Fibonacci, HTF daily support, and volume point of control.
- Key Resistance Rejection: Daily swing high could not be breached on closing basis.
- Market Structure Risk: Loss of support opens door to value area low and swing low.
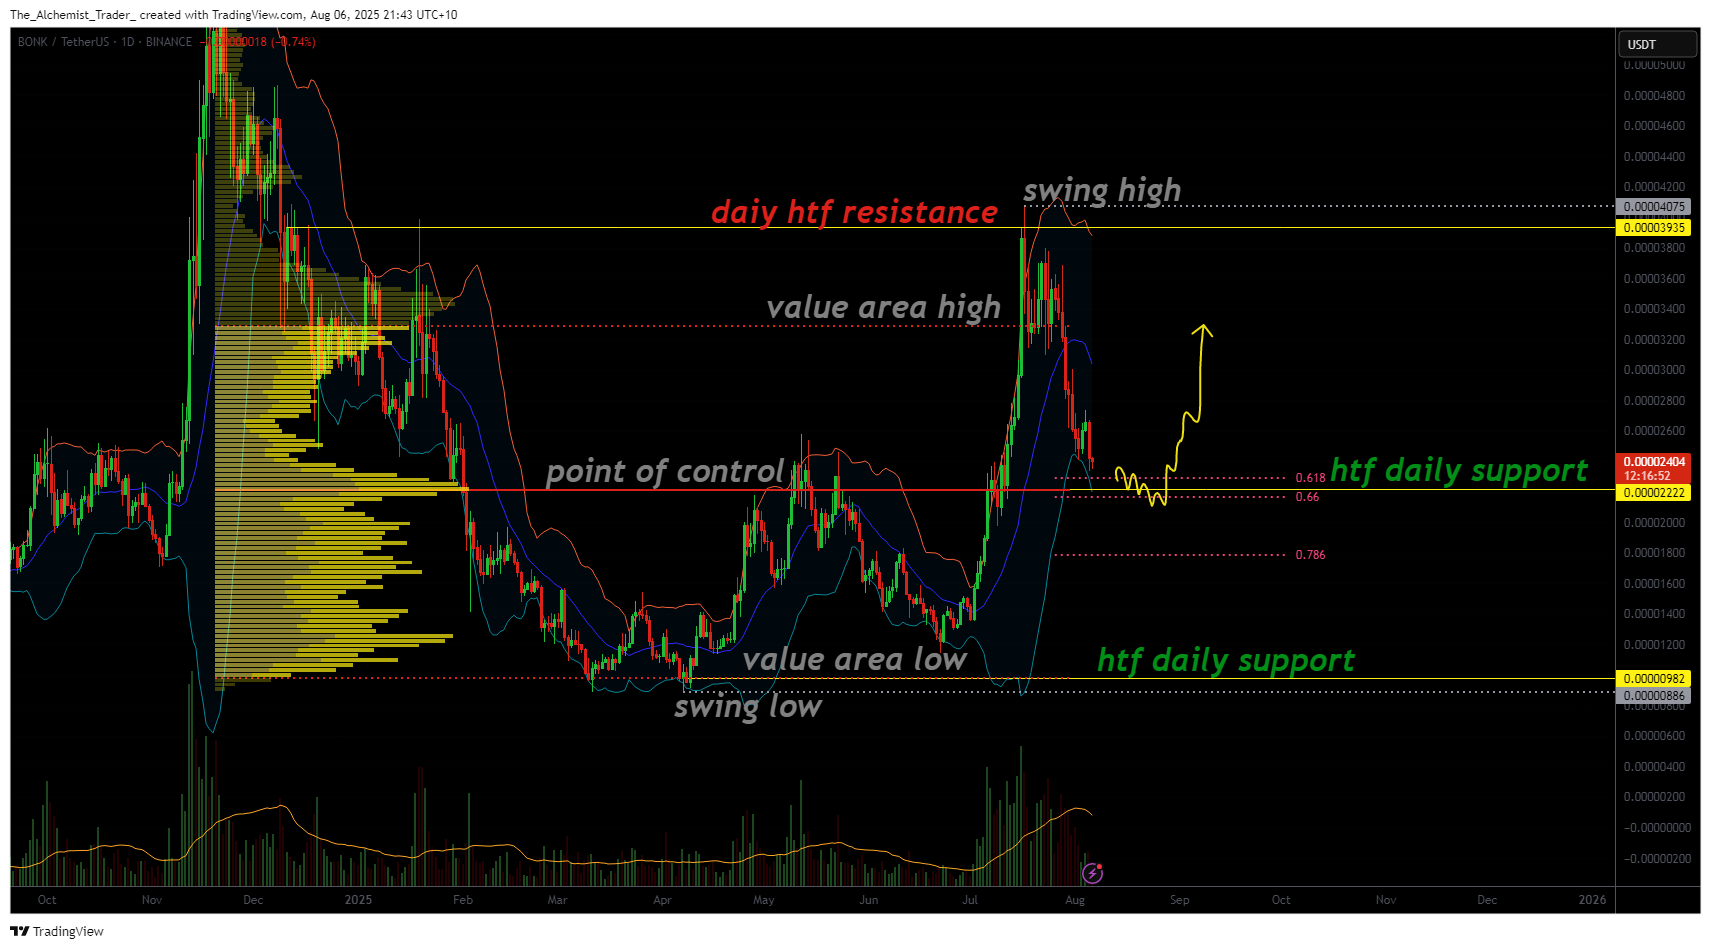
Bonk’s recent price action shows a decisive rejection after testing high time frame resistance near the daily swing high. The inability to close above that resistance led to a shift in momentum, initiating a correction once the value area high was lost. Price has now retraced into a major volume support zone that aligns with multiple technical levels.
This current region combines the 0.618 Fibonacci retracement, which often acts as a strong reversal level during corrections, and the HTF daily support, which has historically served as a base for bullish rotations. Additionally, the point of control from the volume profile is situated in this region, reinforcing the significance of this area as a support cluster.
From a market structure perspective, this is a critical moment. Holding this support would form a higher low in the ongoing bullish trend of higher highs and higher lows. This would keep the larger structure intact and open the probability of a rotation back toward the swing high.
Failure to hold this zone, however, would negate the bullish structure, increasing the likelihood of a move toward the value area low and potentially the swing low, where a much deeper correction could unfold. This would reset the current bullish momentum and bring Bonk back into a broader trading range.
Encouragingly, the volume profile is showing bullish influxes at this level, which could indicate accumulation and support building at this key zone. If this continues and price holds, a reversal becomes increasingly probable. A rotation back toward the previous high would confirm this as a corrective low and reinforce bullish continuation.
Bonk is now at a pivotal level where structure, volume, and trend all converge. Traders should closely monitor whether this region holds, as it will define the strength of the ongoing trend.
What to expect in the coming price action
If Bonk holds the 0.618 Fibonacci and daily support zone, a reversal toward the swing high is likely. A breakdown from here opens the door to lower levels at the value area low.